After consecutive market gains, what should an investor do if a pullback occurs? What does the investor need to know?
The Market After Consecutive Gains
What Should Investors Do If a Pullback Occurs?
What Do Investors Need to Know?
August 28, 2026
What Exactly Happened?
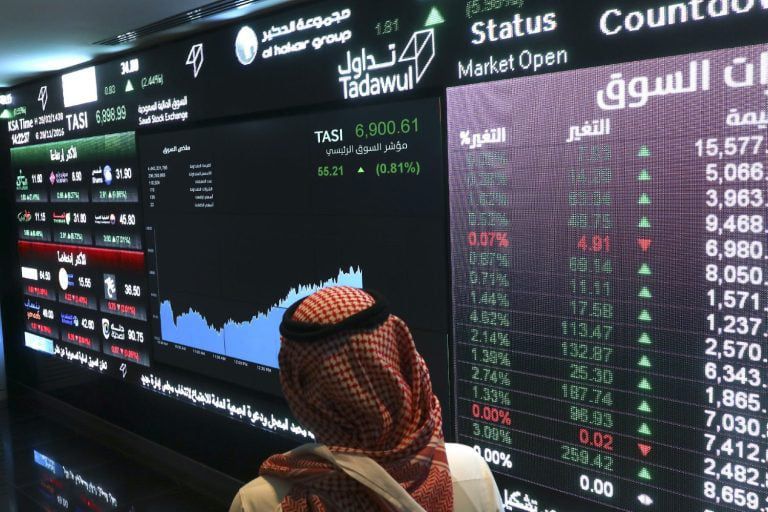
The Saudi market’s main index (TASI) rose by 6.12% over the past four weeks, equivalent to 648.21 points, bringing it close to the 11,200 level.
Approximately two-thirds of this gain (4.03%) came during the period following the appointment of Mazen Al-Sudairi as Chairman of the Capital Market Authority’s Board on August 13, 2026. This was accompanied by an increase in average daily liquidity to SAR 4.83 billion, as well as broader market participation, with 227 companies advancing compared with only 55 declining.
Indicator Value Note
TASI gain over 4 weeks 6.12% (648.21 points) Broader period than Al-Sudairi’s tenure
TASI gain since Al-Sudairi’s appointment 4.03% No regulatory measures announced yet
Average daily liquidity SAR 4.83 billion Since the new chairman’s appointment
Market breadth 227 advancing vs. 55 declining Since Al-Sudairi’s appointment
Source: Tadawul data and market-monitoring platforms, through August 28, 2026.
What stands out is that this rally has occurred without any regulatory measures or concrete reforms being announced by the new authority so far. Meanwhile, the other factors affecting the market have remained largely unchanged: the same geopolitical conditions that accompanied previous periods of decline are still present, while the financial strength of listed companies, infrastructure development, and macroeconomic indicators have not experienced a fundamental change commensurate with the size of the rally.
This suggests that a significant portion of the current rise is closer to a wave of optimism associated with the leadership change than an actual transformation in market fundamentals.
Technical market readings reinforce this interpretation. After a series of rising sessions, the pace of daily gains has gradually slowed, while the rally has become increasingly concentrated in a limited number of leading stocks rather than maintaining the broad participation that characterized the beginning of the move. At the same time, the Relative Strength Index (RSI) has approached overbought territory—technical signals that often precede profit-taking.
Disclaimer: Everything stated above is for educational and informational purposes only and does not constitute a direct recommendation to buy or sell.
Why Does This Warrant Caution?
Recent market commentary has repeatedly warned that the current momentum cannot continue indefinitely without clear and decisive regulatory reforms. Confidence is built through actual decisions, not through waiting for them, and delays in such decisions could erode optimism more quickly than it took to build it.
Under this interpretation, any market pullback following such a rally would not necessarily be surprising; rather, it could be an expected outcome when optimism gets ahead of actual decisions instead of following them.
In other words, the leadership appointment itself is a positive development worth welcoming, but it is not a substitute for tangible reforms in pricing mechanisms, disclosure, and oversight.
Unless the current wave of optimism is translated into concrete decisions within a reasonable period, there remains a possibility that momentum could turn into hesitation, putting renewed pressure on investor confidence.
Disclaimer: Everything stated above is for educational and informational purposes only and does not constitute a direct recommendation to buy or sell.
Weekly Numbers: Which Stocks Are Leading the Optimism?
Closing data highlight the significant divergence between the performance of the broader index and that of individual stocks. There are currently 30 stocks trading more than 25% above their levels at the beginning of the year.
The strongest performers include Petro Rabigh (+153.65%), Kingdom Holding (+79.00%), and MIS (+74.71%).
These gains are concentrated in clear sector groups, particularly insurance—such as Tawuniya, MedGulf Insurance, and Amana Insurance—and pipe manufacturing, including Saudi Steel Pipe, East Pipes, and Arabian Pipes. This suggests that the repricing is occurring across entire sectors rather than being limited to individual stocks.
Company Closing Price Weekly % YTD %
Petro Rabigh 17.35 (3.61%) 153.65%
Kingdom Holding 14.32 1.99% 79.00%
MIS 304 1.00% 74.71%
Enaya 11.79 22.68% 69.88%
Knowledge Economic City 19.15 5.98% 67.69%
Misk 32.08 5.32% 50.82%
GIG 32.14 0.69% 50.33%
MedGulf Insurance 17.30 2.06% 49.52%
Al Rajhi Takaful 57.20 9.68% 47.04%
Arabian Pipes 5.35 3.68% 42.67%
Luberef 136.50 (0.36%) 41.97%
Saudi Steel Pipe 52.35 10.68% 40.80%
Americana 2.36 (2.88%) 40.48%
LIVA 15.31 4.01% 40.46%
Gulf Union Alahlia 14.58 0.41% 38.59%
Electrical Industries 15.48 2.79% 38.21%
East Pipes 189.00 0.59% 36.66%
SADAFCO 16.22 (0.37%) 35.17%
Amana Insurance 8.11 9.89% 34.05%
Jarir Marketing 17.10 2.21% 33.80%
Dar Al Arkan 21.14 3.07% 32.62%
Shams 14.59 0.07% 32.16%
Tihama 21.40 3.68% 31.29%
Al-Waha 2.83 2.91% 31.02%
BSF 21.81 4.91% 29.67%
Jabal Omar 18.88 0.48% 27.74%
Alinma Bank 25.84 3.94% 27.17%
Saudi Cable 177.00 (1.12%) 26.43%
Integrated 14.00 10.41% 26.13%
Cisco Holding 39.14 4.65% 25.61%
Source: Weekly closing data, TASI.
Despite the strong annual performance of these companies, signs of divergence have begun to emerge on a weekly basis. Petro Rabigh declined 3.61%, Americana 2.88%, and Saudi Cable 1.12%, despite their substantial year-to-date gains. This may represent an early indication of partial profit-taking among some of the year’s biggest winners.
At the same time, several stocks posted sharp gains in just one week, with some approaching or exceeding 10% over five trading sessions:
Company Closing Price Weekly % YTD %
Enaya 11.79 22.68% 69.88%
Saudi Ceramics 21.44 21.54% 3.57%
Naseej 17.86 13.32% (20.23%)
Gulf General 4.31 11.08% 9.67%
Azm 26.02 10.91% 10.63%
Saudi Steel Pipe 52.35 10.68% 40.80%
Saudi Re 26.76 10.53% (0.22%)
Integrated 14.00 10.41% 26.13%
Saudi Tadawul Group 133.60 10.14% (4.78%)
Amana Insurance 8.11 9.89% 34.05%
Al Rajhi Takaful 57.20 9.68% 47.04%
FIPCO 36.44 9.43% 19.63%
Source: Weekly closing data, TASI.
Four names appear on both lists—Saudi Steel Pipe, Integrated, Amana Insurance, and Al Rajhi Takaful. This indicates that some of the market’s strongest-performing stocks continue to attract fresh liquidity every week, consistent with the earlier technical observation that the rally has become concentrated in a limited number of leading stocks.
However, two cases deserve additional caution.
Saudi Ceramics jumped 21.54% in a single week, despite being up only 3.57% year to date. This means its weekly move represents almost its entire performance since January.
Meanwhile, Naseej rose 13.32% in one week but remains down 20.23% year to date. This makes its move look more like a technical rebound from an excessively depressed level than a fundamental change in performance.
Both patterns warrant checking the catalyst behind the price movement before assuming that the move will continue.
Disclaimer: Everything stated above is for educational and informational purposes only and does not constitute a direct recommendation to buy or sell.
What Is a “Market Correction” Anyway?
Although there is no single official definition, a correction is commonly viewed as a decline of 10% or more from a recent high reached by an index or stock.
A correction is a natural and recurring phenomenon in financial markets. It occurs as the market attempts to restore balance between the underlying value of assets and the potentially excessive expectations that can accompany rapid rallies.
Corrections can last anywhere from a few days to several months and do not necessarily signal the end of a long-term uptrend.
Common catalysts for corrections include:
Political and geopolitical headlines that trigger selling of risk assets and a flight toward safe havens.
Weak economic data, including inflation, employment, and broader macroeconomic indicators.
Earnings seasons in which companies report results below market expectations.
In the current Saudi context, a fourth factor can be added: the regulatory expectations gap—the difference between the level of hopes placed on new leadership and the scale of actual decisions announced so far.
Disclaimer: Everything stated above is for educational and informational purposes only and does not constitute a direct recommendation to buy or sell.
What Should a Long-Term Investor Do?
Rebalance the portfolio: Consecutive gains in a particular sector or stock can cause its weight in the portfolio to exceed the originally planned allocation. Selling a small portion and reallocating it to more stable assets can restore the portfolio to its target proportions without exiting the market completely.
Return to periodic buying rather than investing all at once: Avoid deploying a large amount of capital near market highs. Instead, divide available cash into periodic installments to achieve a more favorable average entry price if a subsequent pullback occurs.
Lock in part of the profits: Consider selling a limited percentage—such as 10% to 20%—of particularly profitable positions, especially in stocks that have led the recent rally. This converts part of the unrealized gains into actual cash in preparation for a potential correction.
Disclaimer: Everything stated above is for educational and informational purposes only and does not constitute a direct recommendation to buy or sell.
What Should a Short-Term Trader Do?
Do not chase the price (avoid FOMO): Buying at market highs out of fear of missing an opportunity is one of the most common mistakes. Waiting for a healthy correction or a retest of clear support levels can be safer than chasing the move.
Tighten stop-loss orders: Gradually raise stop-loss levels using a trailing stop for existing positions. This can help protect realized gains without closing a position prematurely if the trend suddenly reverses.
Reduce the size of new positions: As volatility increases near market highs, reducing the amount of capital at risk in each new trade can limit both the financial and psychological impact of a reversal.
Disclaimer: Everything stated above is for educational and informational purposes only and does not constitute a direct recommendation to buy or sell.
A Short Framework for Assessing the Current Phase
Before making a buy or sell decision while the rally continues, investors can consider the following factors:
Factor Suggested Action Objective
Available liquidity Maintain at least 15–20% of the portfolio in cash Ability to buy if a genuine correction occurs
Valuation check Compare current P/E multiples with historical averages and fair value Ensure the rally is supported by earnings rather than speculation alone
Sector allocation Reduce exposure to sectors that led the rally and increase defensive exposure, such as food and healthcare Reduce portfolio volatility if leading sectors decline
Existing positions Gradually raise stop-loss levels using a trailing stop Protect realized gains without exiting too early
Risk warning: Deploying all available cash at the peak of a consecutive rally—particularly in the absence of announced regulatory decisions—could expose capital to a sudden correction or leave liquidity tied up for a relatively long period if momentum slows before such decisions are announced.
Disclaimer: Everything stated above is for educational and informational purposes only and does not constitute a direct recommendation to buy or sell.
What Does All of This Mean for Investors?
A rise in the index following the appointment of new leadership does not necessarily mean that fundamentals have changed. Distinguishing between “appointment-driven optimism” and the “actual impact of reforms” is essential when assessing the sustainability of the current rally.
Broad market participation—227 advancing companies versus only 55 declining—is a positive sign for the health of the rally so far. However, any subsequent deterioration in market breadth deserves close monitoring.
The absence of regulatory measures so far does not mean that they will not be announced. It does mean, however, that part of current market valuations is based on expectations that have not yet materialized, which justifies maintaining a margin of safety in the portfolio.
A market correction, if it occurs, is not necessarily a permanently negative signal. It may instead represent an opportunity to reposition for investors who have available cash and a clear plan, rather than becoming a surprise that triggers emotional and random decisions.
Disclaimer: Everything stated above is for educational and informational purposes only and does not constitute a direct recommendation to buy or sell.
Conclusion
TASI has posted a notable 6.12% gain over the past four weeks, with approximately two-thirds of that rise occurring after the appointment of Mazen Al-Sudairi as Chairman of the Capital Market Authority, amid broader market participation and higher liquidity.
However, this rally has preceded any announcement of concrete regulatory measures, while other factors—from geopolitical conditions to economic fundamentals—have remained largely unchanged. This makes a significant portion of the rally appear more like a wave of optimism than a fundamental transformation.
Individual-stock data support this interpretation: 30 companies are up more than 25% year to date, with some adding weekly gains close to or above 10%. There are also clear examples of sharp one-week price jumps that are not matched by comparable year-to-date performance.
Whether an actual correction occurs or momentum continues, advance preparation—through maintaining available cash, verifying the valuation of each individual stock, and maintaining balanced risk exposure—remains more important than trying to predict the timing of the market’s next move.
Together, we analyze. Together, we learn. Together, we profit.